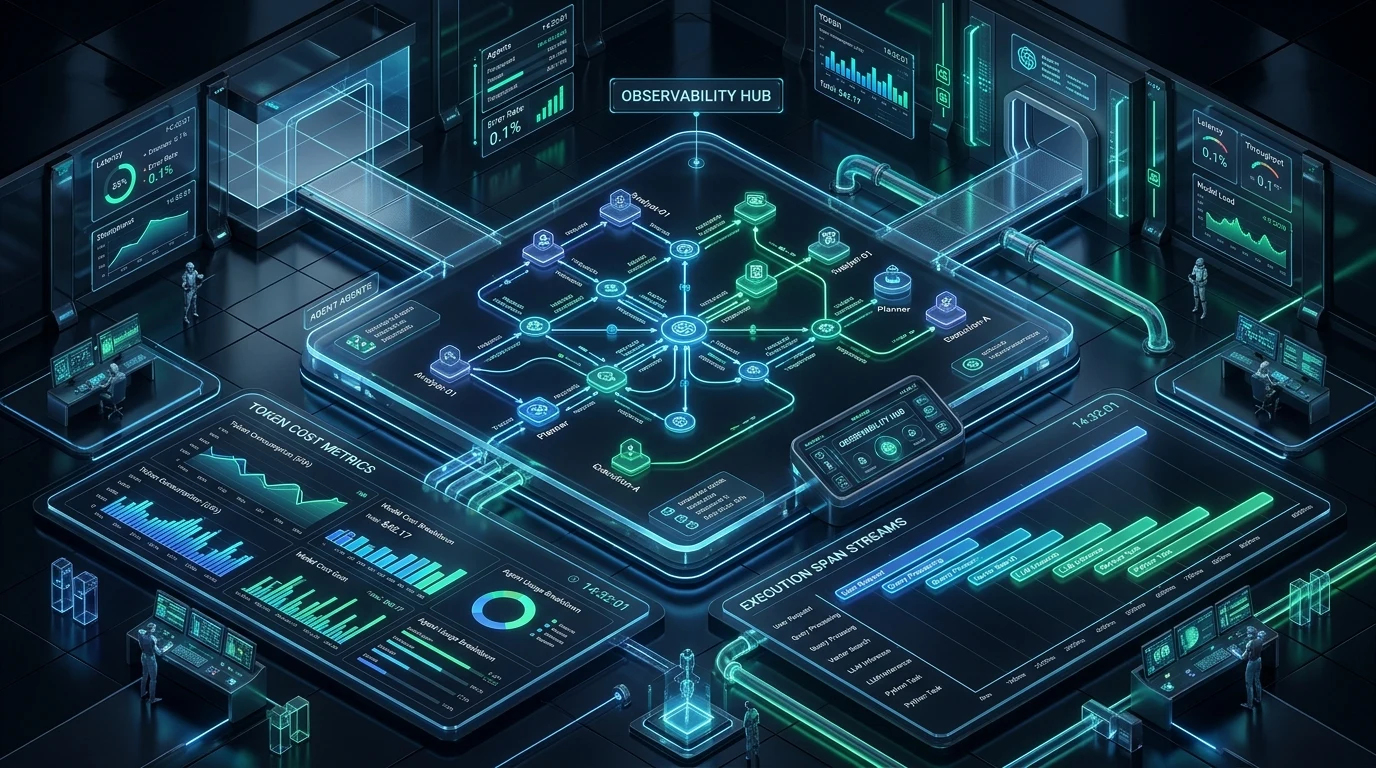
Moving autonomous AI agents from local prototypes to production environments introduces an entirely new engineering reality. While traditional web backends follow deterministic request-response cycles, modern multi-agent systems built with LangGraph, CrewAI, or self-hosted n8n MCP gateways execute dynamic, multi-turn graph traversals.
In a live environment, an unchecked agent loop can query internal databases, spin up sub-agents, invoke external APIs, and consume hundreds of thousands of reasoning tokens in seconds. Traditional APM tools will report everything as healthy—CPU is at 15%, memory is stable, and the HTTP gateway returns 200 OK. Meanwhile, your agent has spent 12 minutes stuck in a circular validation debate and burned through $35 in API credits.
Without end-to-end Agent Observability, you are running production systems blind. This guide covers the architectural patterns, OpenTelemetry telemetry schemas, and loop-breaking circuit breakers required to run multi-agent workflows reliably without unexpected bills.
⚡ The Core Rule of Agent Observability
Traditional monitoring tracks server health. Agent observability tracks non-deterministic execution graphs: per-node token attribution, reasoning token ratios, prompt/completion drift, SHA-256 state fingerprint loop detection, and automated Human-in-the-Loop (HITL) pause triggers.
1. The Production Reality Gap: Why Autonomous Agents Fail Silently
When an agent fails in production, it rarely throws a clean 500 Internal Server Error. Instead, it fails through non-deterministic semantic breakdown. There are four failure modes we see repeatedly in multi-agent pipelines:
- The Hallucinated Tool Retry Loop: An agent calls an MCP tool, receives a schema validation error, slightly tweaks the argument, and retries. I once watched an agent look completely green on Prometheus dashboards (15% CPU, 0 server errors) while silently chewing through $40 in under 20 minutes because it was caught in an unmonitored MCP tool retry loop.
- Cascading Context Poisoning: In a pipeline where Agent A feeds Agent B feeds Agent C, a slight factual hallucination by Agent A becomes accepted ground truth for Agent B, causing Agent C to generate completely fabricated conclusions with high confidence.
- Hidden Reasoning Token Bleed: High-reasoning models like DeepSeek-R1 and OpenAI o1 produce internal reasoning traces that can consume 4,000 to 16,000 tokens before emitting a single word of visible output. Without span-level token logging, you won't know why a single user prompt cost $1.80.
- Context Saturation & Latency Creep: As conversational history accumulates in memory, every subsequent LLM call takes longer to compute and costs more. By turn 10, time-to-first-token (TTFT) can climb from 800ms to over 8 seconds.
2. Token & Cost Observability: Hard Budgets and User Attribution
To operate multi-agent systems sustainably, cost tracking must be evaluated at every individual node invocation—not as an aggregate figure on your monthly OpenAI or Anthropic invoice. Every span in your execution tree needs to record input tokens, output tokens, reasoning/cache tokens, and calculated dollar cost.
| Observability Metric | Target Granularity | Enforcement Mechanism | Alert Threshold |
|---|---|---|---|
| Per-Session Cost Cap | Session / Workflow Run | Hard Gateway Abort Hook | > $0.75 / single session |
| Reasoning Token Ratio | Per-Model Inference Step | Dynamic Model Fallback (o1 → Sonnet / Flash) | Reasoning Tokens > 75% Total |
| Tool Execution Iterations | Per-Task Trajectory | Max Turn Counter Circuit Breaker | > 6 tool calls / turn |
| Tenant / User Attribution | Tenant ID Header | Token Quota Throttling | 80% of Monthly Plan Limit |
3. Distributed Execution Tracing: Correlation IDs Across Multi-Agent Chains
When an autonomous workflow spans multiple components (e.g., an n8n webhook triggering a LangGraph state machine, which queries an MCP server on another server), debugging requires an end-to-end Distributed Trace Tree.
Following OpenTelemetry (OTel) GenAI semantic conventions, an ingress request generates a global trace_id. Every subsequent LLM call, sub-agent handoff, and tool execution inherits this trace ID while generating its own unique span_id and parent_span_id.
Below is a production-grade Python implementation using non-blocking BatchSpanProcessor and a loop breaker:
import time
import hashlib
from opentelemetry import trace
from opentelemetry.sdk.trace import TracerProvider
from opentelemetry.sdk.trace.export import BatchSpanProcessor
from opentelemetry.exporter.otlp.proto.http.trace_exporter import OTLPSpanExporter

# 1. Initialize OpenTelemetry with non-blocking Batch processor
provider = TracerProvider()
otlp_exporter = OTLPSpanExporter(endpoint="http://localhost:4318/v1/traces")
provider.add_span_processor(BatchSpanProcessor(otlp_exporter))
trace.set_tracer_provider(provider)
tracer = trace.get_tracer("agenticspulse.orchestrator")

class AgentCircuitBreaker:
    def __init__(self, max_turns=8, max_cost_usd=0.50):
        self.max_turns = max_turns
        self.max_cost_usd = max_cost_usd
        self.turn_count = 0
        self.total_cost = 0.0
        self.action_hashes = []

    def record_step(self, action_name: str, payload_str: str, cost_usd: float):
        self.turn_count += 1
        self.total_cost += cost_usd

        # Calculate fingerprint to detect identical repeated loops
        fingerprint = hashlib.sha256(f"{action_name}:{payload_str}".encode()).hexdigest()
        self.action_hashes.append(fingerprint)

        if self.turn_count > self.max_turns:
            raise RuntimeError(f"Circuit Breaker: Exceeded max turns ({self.max_turns})")

        if self.total_cost > self.max_cost_usd:
            raise RuntimeError(f"Circuit Breaker: Budget exceeded (${self.total_cost:.3f} > ${self.max_cost_usd})")

        # If the last 2 actions were byte-for-byte identical, halt immediately
        if len(self.action_hashes) >= 2 and self.action_hashes[-1] == self.action_hashes[-2]:
            raise RuntimeError("Circuit Breaker: Infinite tool retry loop detected.")

# Example wrapped tool execution
def execute_agent_tool(tool_name: str, tool_args: dict, breaker: AgentCircuitBreaker):
    with tracer.start_as_current_span(f"tool.{tool_name}") as span:
        span.set_attribute("gen_ai.system", "tool_execution")
        span.set_attribute("agent.tool_name", tool_name)

        breaker.record_step(tool_name, str(tool_args), cost_usd=0.002)
        span.set_attribute("gen_ai.usage.cost_usd", 0.002)
        return {"status": "success", "output": "records retrieved"}
4. Error Monitoring, Loop Detection, and Automated HITL Escalation
In deterministic software, exceptions crash threads. In agentic workflows, errors manifest as subtle loops or semantic drift. A reliable observability layer needs automated circuit breakers:
1. State Fingerprint Hashing: Compute a SHA-256 hash of the agent's proposed action and argument payload. If identical hashes occur twice consecutively, halt execution immediately.
2. Automated Human Escalation (HITL): When a circuit breaker trips, pause the workflow execution graph and push a structured webhook payload to Slack, Discord, or an internal dashboard. Operators can inspect the full execution trace and select Resume, Override Arguments, or Abort.
5. Architecture Benchmark: Comparing Observability Solutions
Engineering teams evaluating telemetry platforms in 2026 generally choose between managed cloud SaaS and self-hosted open-source pipelines:
| Framework / Platform | Hosting Model | Key Strength | Best Fit Use-Case |
|---|---|---|---|
| LangSmith | Managed Cloud / Enterprise | Deep native LangGraph debugging & prompt playground | Teams heavily invested in LangGraph ecosystems |
| Arize Phoenix | Self-Hosted / Open Source | OpenTelemetry native, evaluation benchmarks, and zero licensing fees | Self-hosted teams requiring data sovereignty |
| Helicone | Cloud Proxy / Self-Hosted | Zero-code proxy integration, instant caching, and rate limiting | High-throughput API billing and caching layer |
| n8n + ClickHouse / Postgres | 100% Self-Hosted Bare Metal | Custom span pipelines, zero external dependency, minimal overhead | Solopreneurs & private enterprise automation stacks |
6. Self-Hosted Observability Blueprint for n8n & Local AI
For solopreneurs and privacy-conscious teams running on self-hosted VPS instances, you can build a complete observability pipeline inside n8n and Docker without paying $500+/mo in monitoring SaaS fees:
Step 1: Global Error Trigger Node: Configure a master Error Trigger workflow in n8n that captures all unhandled execution exceptions across all sub-workflows.
Step 2: Structured Span Logging: In your primary agent loop, append a custom Code node after every LLM inference block that extracts $json.usage.total_tokens and calculates estimated spend against your model pricing matrix.
Step 3: Edge Telemetry Storage: Stream the structured trace JSON into a localized SQLite, PostgreSQL, or ClickHouse database. This data powers a lightweight, real-time Grafana dashboard visualizing daily spend, error frequencies, and latency trends.
7. Multi-Agent Observability Gateway Architecture
In a production architecture, the telemetry pipeline sits as a non-blocking proxy between your autonomous agents, execution tools, and human operators:
┌───────────────────────────────────────────────────────────┐
│              Multi-Agent Ingress Orchestrator             │
│        (n8n / LangGraph / CrewAI Workflow Engine)         │
└─────────────────────────────┬─────────────────────────────┘
                              │ Injects: trace_id & correlation_id
┌─────────────────────────────▼─────────────────────────────┐
│           OpenTelemetry Distributed Tracing Proxy         │
│  • Token Cost Counter        • State Hash Loop Detector   │
│  • Latency Breakdown         • Budget Cap Circuit Breaker │
└──────────────┬─────────────────────────────┬──────────────┘
               │ Async Telemetry Span        │ Validated Execution
┌──────────────▼──────────────┐┌─────────────▼──────────────┐
│  ClickHouse / Phoenix DB    ││   MCP Tool Servers (n8n)   │
│  (Real-Time Audit Logs)     ││  (Databases, APIs, Scripts)│
└──────────────┬──────────────┘└─────────────┬──────────────┘
               │ Anomaly & Cost Breach       │ Result Payload
┌──────────────▼──────────────┐┌─────────────▼──────────────┐
│  Human-in-the-Loop Gateway  ││  Final Response Synthesizer│
│  (Slack Alert / Auto-Pause) ││  (Delivered to Client)     │
└─────────────────────────────┘└────────────────────────────┘
8. Frequently Asked Questions (FAQ)
What is the difference between traditional APM and AI Agent Observability?
Traditional Application Performance Monitoring (APM) tracks server uptime, CPU load, and deterministic HTTP request-response latency. AI Agent Observability focuses on non-deterministic execution paths: tracking prompt token explosion, semantic drift, reasoning loop anomalies, tool execution outputs, and per-step token attribution across autonomous multi-agent pipelines.
How do you prevent multi-agent loops from draining token budgets?
Implement circuit breaker middleware and hard budget caps at the proxy level. Enforce max-hop limits (e.g., maximum 8 tool iterations per session), track cumulative token spend via distributed correlation IDs, and trigger Human-in-the-Loop (HITL) pause hooks whenever consecutive tool call outputs yield identical state hashes.
Can you implement agent observability in self-hosted n8n without expensive SaaS platforms?
Yes. By utilizing n8n Global Workflow Error Triggers, OpenTelemetry Collector sidecars, and logging structured execution spans to a self-hosted database (such as ClickHouse or PostgreSQL), teams can build a fully sovereign, real-time agent telemetry pipeline without recurring per-seat SaaS costs.
9. Conclusion & Production Implementation Checklist
Observability is no longer an optional optimization—it is the foundational prerequisite for running autonomous multi-agent systems reliably at scale. By instrumenting every agent with distributed trace IDs, enforcing hard budget circuit breakers, and automating human escalation gates, organizations can confidently deploy agentic workflows without risking unmonitored failures or runaway API bills.
To explore more on building resilient automation engines, review our comprehensive guides on Building a Production MCP Server in n8n and DeepSeek-R1 vs OpenAI o1 Enterprise Token Economics.